Everybody likes a pretty picture more than copy. It’s easier and more fun to look at a graphic. But, how do you use infographics in your marketing? We answer these questions and several others, so read on.
Using Infographics for Marketing
There are, primarily, two ways to include infographics .
1. Use Infographics to Generate Inbound Links
Infographics are colorful and organized, so they catch the eye. If your content is on target within the infographic, you’ll generate a lot of inbound links.
Case in point—research shows that colored visuals increase how willing people are to read a piece of content by 80%.
2. Use Infographics to Encourage People to Share Your Content
Visual content gets shared. Period. And most of us can understand why. It’s more fun to look at content when its paired with an image or a graphic that makes the content more digestible.
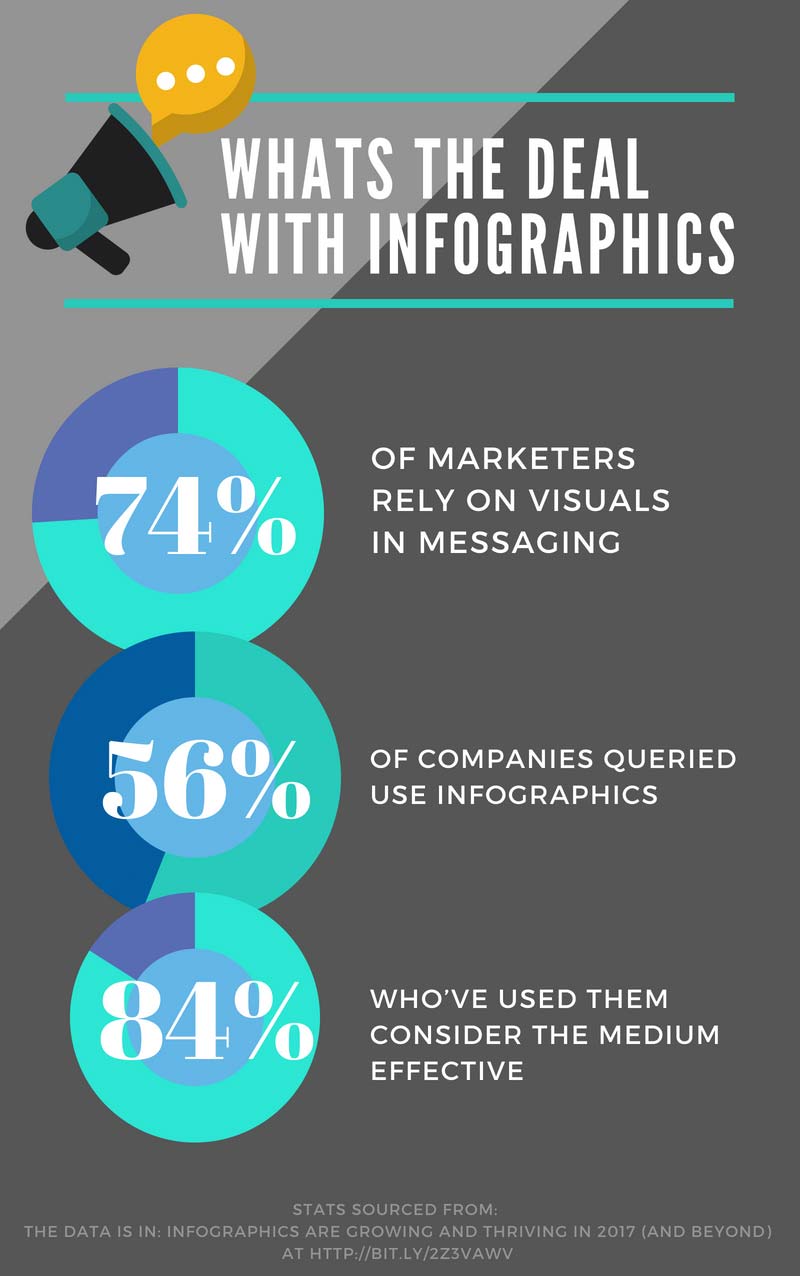
According to research, visual content is 40X more likely to be shared than copy. But infographics take the cake! They are liked and shared 3x more than any other type of content.
Of course, if you want your infographic to generate inbound traffic and get shared, it’s got to look good and contain the right stuff.
Creating Infographics—What Should Your Infographic Include If You Want It to Generate Inbound Links and Get Shared?
Using infographics for marketing is easier when you know how to create them, and you have a sense for how to use them for marketing.
Now that you know how you can use them—to generate inbound links and increase your number of shares—it’s time to breakdown how to create them. Here’s a few steps and tips to keep in mind.
1. Words People Care About
Even though you’re using a graphic that will catch the eye, you still need to fill that graphic with content that will be relevant and valuable to your audience. Obviously, you’ll want to include copy that’s relevant to your topic, but if you can make that copy more compelling, you should do so.
Here are a few ways to catapult the “intrigue” factor of the content you’ll put in your infographic:
- Use scarcity. Remind people that life is short or add urgency to your content.
- Inspire. People dream of what their life could look like. Help them envision that life.
- Tell a story. Stories engage readers and people remember them.
- Confirm/challenge. Confirm or challenge what people know to be true.
2. Data

Perhaps you associate marketing with infographics with data? That makes sense. Infographics are great at presenting a lot of data in a nice way that’s also easy to digest.
So, be sure to include thought-provoking stats that relate to your topic and support your position. In fact, if you do nothing else, do this. Just, as your college professor would say, cite your sources.
Here a few tips to consider when adding data to your infographic:
- Use visuals like pie charts, line graphs, and bar graphs to present data.
- Don’t include too much—present only the most powerful statistics (these would be the stats that make your point best).
3. Design elements

To attract people and get the traffic and shares you want, you need to make sure your infographic looks good. To do that, you apply design principles.
Here are a few tips to keep in mind:
- Use lots of white space. It gives the eye a break and consequently attracts the eye to the graphic.
- Help people to visualize your data. In other word, show it don’t tell it. There are many ways to present numbers visually. Though, this does require some creativity.
If you aren’t good at representing data visually and creatively, hire a designer to do the design part of your infographic, because an infographic is really a “datagraphic” and if you’re “datagraphic” isn’t designed well, it won’t catch the eye, and there ends your marketing with infographics.
Promoting Infographics—Where Do We Start and What Do We Do?
Once you’ve got your infographic ready to go, it’s time to promote it so that you can get those inbound links and shares. To promote your infographic, you’ll want to take the following steps.
1. Complement/Support Existing Marketing
Effective marketing starts with a well laid out plan. Your marketing strategies and goals go within that overall plan. Your infographic promotion should support, enhance, or complement all your other marketing.
2. Make It Clear People Can Share Your Infographic
You can embed code in your infographic that makes it clear people can share the graphic. You’ll want to do this, because one of the reasons why you use infographics in your marketing is because they’re great at getting others to share your content and brand.
3. Share with Your Network First
What do you do when you have something you want people to know about? You tell the people you spend time around first, right? Okay, maybe you post about it on social media too.
And that’s exactly what you want to do with your infographic.
Share it with your network first.
How you choose to do that is up to you.
You could post the infographic on your Facebook, Twitter, LinkedIn, Instagram or Pinterest account. You could include it in an email marketing campaign or share it directly with a few key individuals. You could put it on your blog for your community to see or share it with employees.
You might just want to do all those things, and that’s great! You should.
4. Ask for The Share
When you share an infographic with your network, ask them to share it with their network.
This gets the ball rolling.
Soon, you’ll see your infographic in places that will please and surprise you!

Comments
Post a Comment